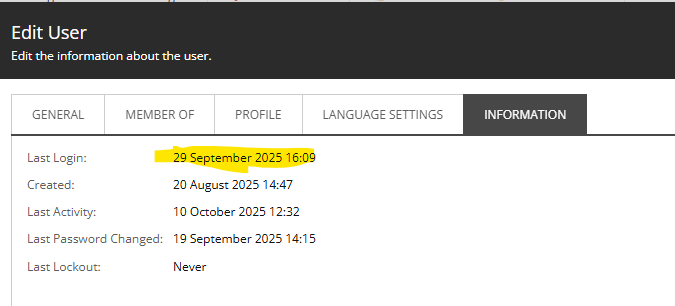
Appending Sitecore Logs into Application Insights

Sitecore uses log4net, which makes it relatively easy to set up new destinations for logs, etc.. One request we’d had was to log messages in the Sitecore logs into Application Insights.

I approached this by writing a custom appender, which would take our messages and write them to App Insights as Trace messages. This is what I came up with:

Continue reading “Appending Sitecore Logs into Application Insights”
Advertisement
Appending Sitecore Logs into Application Insights

Splitting “Sitecore/Index” requests into their actual pages

Application Insights records requests for all content pages in Sitecore as being for “Sitecore/Index”. That’s because this is the controller route under which those pages are processed – but it’s not that helpful if you want to see things like the performance of individual pages. Well, there is an answer, as detailed by Per Osbeck – Application Insights: GETing a fix for Sitecore/Index | by Per Osbeck | Medium .

The short form of this is he used a TelemetryProcessor to update the item.Context.Operation.Name and request.Name to the absoluteUrl being processed.

Continue reading “Splitting “Sitecore/Index” requests into their actual pages”
Splitting “Sitecore/Index” requests into their actual pages

Sitecore’s LevelRangeFilter may unexpectedly terminate your log4net filter chain

TL;DR – Due to strange functionality and a poorly chosen default, Sitecore’s log4net.Filter.LevelRangeFilter may unexpectly terminate the chain of log4net filters you’ve configured, without later filters even being considered. This can be fixed by setting the “AcceptsOnMatch” attribute to false.

Continue reading “Sitecore’s LevelRangeFilter may unexpectedly terminate your log4net filter chain”
Sitecore’s LevelRangeFilter may unexpectedly terminate your log4net filter chain

Azure WAF does not play nicely with Web Apps

Recently I’ve been working on a Sitecore site that is using Azure App Gateway, and it is using the Web Application Firewall (WAF) features of that too. Broadly, I’ve been quite impressed, but I did come across a few problems.

OWASP publish a set of rules used in ModSecurity to try to identify anomalous traffic. These rules then total into a score of “how anomalous this request is”. Finally, there is one rule that checks that score, and potentially blocks traffic based on it.

We found we were getting traffic blocked. Here’s what we found.

Continue reading “Azure WAF does not play nicely with Web Apps”
Azure WAF does not play nicely with Web Apps

Sitecore TDS – Could not find assembly Sitecore.Data.Resourceitems.Protobufnet.dll

So I am working on a Sitecore 10.1.2 project, and we’re using TDS 6.0.0.36. When I tried building the update package I got the error:

GENERATEPACKAGE : error : Could not find assembly sitecore.data.resourceitems.protobufnet.dll
GENERATEPACKAGE : error : Could not find assembly sitecore.data.resourceitems.abstractions.dll
C:\git\Blah\packages\HedgehogDevelopment.TDS.6.0.0.36\build\HedgehogDevelopment.TDS.targets(186,5): error : The package builder failed. Please set the build logging level to Normal or Detailed and see the build output log for more information on the failure.

This was odd, as Sitecore 10.1.2 does not contain either of those assemblies. But they did look familiar. After a bit of digging, I found them… in Sitecore 10.2. But I’m not using Sitecore 10.2… but that’s what it’s looking for.

Continue reading “Sitecore TDS – Could not find assembly Sitecore.Data.Resourceitems.Protobufnet.dll”
Sitecore TDS – Could not find assembly Sitecore.Data.Resourceitems.Protobufnet.dll

Setting Application Insights connection string for Client JavaScript

So, if you’re using Application Insights, you may choose to use the client-side JavaScript API. This is a snippet that will allow you to use Application Insights in JavaScript – and conventiently it records lots useful error, dependency and trace data, allow with PageView data. It’s pretty nifty, and also supports filters and telemetry enrichment.

In that snippet, you’ll find lots of mention of a configuration setting “instrumentation key”. This is the ID of the app insights instance that your data will be sent to.

The thing is, it has been deprecated in favour of “connection string”. This is the same connection string as you use server-side (as described previously), and can be read from:

string aiConnection = TelemetryConfiguration.Active?.ConnectionString;

You should do this and render the connection string rather than hard-code it into your layout page.

Setting Application Insights connection string for Client JavaScript

Configuring Hard-to-reach settings in Sitecore Containers

I’ve had a problem with some Containers I’m configuring – how do I set machine/environment specific settings in those containers? I can’t just patch them in with Sitecore patches – the files in the image are supposed to be immutable.

I could use Environment Variables (which is what the Sitecore container images do for App Settings and Connection Strings), and the $(env:variablename) syntax gives a way of doing that – but it could mean editing a lot of places.

Well, there’s a better way, and Vitalii Tylyk describes a nice way to do this – Sitecore environment variables config builder.

That’s pretty nifty, but I wonder if it could be adjusted to set cache sizes too…

Configuring Hard-to-reach settings in Sitecore Containers

Setting your Application Insights Connection String

If you’re adding Application Insights to your solution, you will need to specify a connection string. Usually, this is at the bottom of your applicationinsights.config file:

A nifty alternative is you can specify this connection as an Environment Variable – and App Insights will pick that up and use it…

Continue reading “Setting your Application Insights Connection String”
Setting your Application Insights Connection String

Debugging – Why my Content Editor was so slow

A customer reported to me that their content editor would freeze for 5 minutes if you clicked the root node of their site in Content Editor. I was surprised – bit when I went and did so, it froze for 5 minutes.

Now, this was on a newly upgraded and replatformed system, so I when and tried their existing system – and had the same result. The first click on the root node would take 5 minutes to load. So, it wasn’t our upgrade – but that I could study more easily. As it was the first click only, I figured caching was involved – but what gives? How do I find out what’s going on?

Continue reading “Debugging – Why my Content Editor was so slow”
Debugging – Why my Content Editor was so slow