Previously I’ve posted how to do this – but it was a bit hacky. You had to know your Admin’s UserID, which can change between instances now. So, here’s the SQL to do it for any Sitecore\Admin user…
Update membership
    set [Password] = '2hwfEqtM7gDFekQaV/IOkog5DFmxRtywvUsRJqRf7j82Ns3pUkiu/WohjLk8mIV2+7MjXdMeO9MgAUjildTLtg==',
	[PasswordSalt] = 'ETJOU1+PX4CwEOw/eN3F6Q==',
	[IsLockedOut] = 0,
	[Comment] = 'Sitecore Administrator (512)'
from [aspnet_Membership] membership
INNER JOIN [aspnet_Users] users ON membership.UserId = users.UserId
WHERE users.UserName = 'sitecore\Admin'
We’re looking to introduce whitelisting of Query String parameters on one of our customer’s sites. But that begs the question – what query strings parameters are in use? What are the most popular?
Well, I should be able to get this from the Application Gateway logs in Azure. But of course, the trick is in the right query. It took a bit of figuring out, but I got this:
AzureDiagnostics
| where Category == 'ApplicationGatewayAccessLog'
| where TimeGenerated > ago(7d)
| where isnotempty( requestQuery_s )
| extend qp = parse_urlquery(requestQuery_s)["Query Parameters"]
| extend keys = bag_keys(qp)
| mv-expand keys
| summarize count() by tostring(keys)
| order by count_ desc
This get the query string parameters for each query that has a query string, parses them, gets the keys (i.e. the parameters) and summarizes by them. Nifty.
We have our Sitecore instance writing it’s logs into Trace messages in App Insights. There is some filtering, but basically, the message written to the log file is put in the Message field of the Trace entries. So, an entry in the publishing log file would look like:
21192 14:23:07 INFO ##Publish Item: Name=Home, Uri=sitecore://master/{110D559F-DEA5-42EA-9C1C-8A5DF7E70EF9}?lang=en&ver=1, Operation=Skipped, ChildAction=Allow, Explanation=The source and target items have the same revision number.
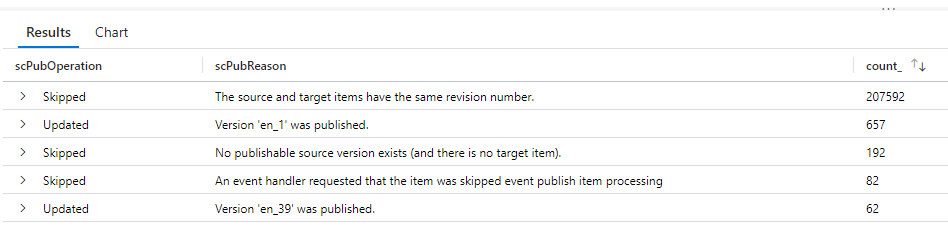
And in App Insights, it looks like:
The problem was, I wanted to summarize details about these publishes, but the details are all part of one big string. Specifically, I wanted to see the count of the operation, and the reason for that operation. I was expecting to have to do some big regex to figure it out.
This is a tale about the surprising logic in Sitecore.MainUtil.GetBool(), and an interesting interaction between it and Checkbox fields on an item. Let me start with the question, what’s wrong with this?
Last week we had an issue that caused Sitecore to be unable to connect to SolrCloud. Therefore, the container Readiness healthchecks failed, resulting in loss of service. This has been fixed.
During the incident, we noticed in the telemetry that we were seeing Healthcheck Failures for most of the search indexes. However, not all – master, web, and preview were all missing. This was puzzling. One commonality between the missing checks was that all missing indexes used Switch on Rebuild functionality to ensure service, even during a full index rebuild.
We’re using AppInsights with our Sitecore10 system, and one frustration we have is that our “Failures” report contains thousands of entries for 404 responses. Unfortunately, these days, just having a site means you’re going to get a tonne of requests for “potentially vulnerable paths” – such as the WordPress login, Drupal Login, PHP Info pages, etc.. None of these paths are ever going to be in our site, and conceptually, is it really an error if we respond to someone who is spamming our site with requests that a particular page doesn’t exist? It’s just making it harder to see the genuine issues we actually care about.
To that end, I wanted to set some of the 4xx responses from our site to be “Successful” in AppInsights. I came up with this TelemetryInitializer…
We are running Sitecore 10 in containers, and we have multiple environments. We’ve also got multiple server roles. We’d like our telemetry to App Insights to tell us a) what instance is this for, and b) what role is this for.
Sitecore uses log4net, which makes it relatively easy to set up new destinations for logs, etc.. One request we’d had was to log messages in the Sitecore logs into Application Insights.
I approached this by writing a custom appender, which would take our messages and write them to App Insights as Trace messages. This is what I came up with:
Application Insights records requests for all content pages in Sitecore as being for “Sitecore/Index”. That’s because this is the controller route under which those pages are processed – but it’s not that helpful if you want to see things like the performance of individual pages. Well, there is an answer, as detailed by Per Osbeck – Application Insights: GETing a fix for Sitecore/Index | by Per Osbeck | Medium .
The short form of this is he used a TelemetryProcessor to update the item.Context.Operation.Name and request.Name to the absoluteUrl being processed.