Sitecore’s installer for Azure app services installs a neat feature; a Log4Net appender that writes Sitecore log entries to Application Insights as TRACE messages. Nifty! However, for reasons I cannot comprehend, this is not included in the normal installer. That’s a terrible shame, as App Insights is still useful for Sitecore running on actual tin or in a VM.
Continue reading “Writing Sitecore Logs to Azure Application Insights in IAAS/On Prem”AppInsights
Filtering App Insights Server-side Dependency messages
So, previously I’ve written about filtering out all the successful Dependency messages going to App Insights. What about unsuccessful ones, though?
My Sitecore instance seems have a failing dependency that is clogging up my logs. It’s the same as mentioned in this StackExchange question. It doesn’t seem to cause any issue, though… and it isn’t every environment either. Anyway, I’d like to block it. Telemetry processors to the rescue…
Continue reading “Filtering App Insights Server-side Dependency messages”Filtering App Insights server-side Health Check requests
So, again, I’m trying to tame Application Insights. My logs are filling up with various requests for different health-check URLs. These get requested, over and over, day after day, and all are recorded in App Insights as Requests. However, I don’t care about these requests if they’re successful. In fact, I only care about if they fail. Can I exclude them?
Yes, I can. I’ll build a telemetry processor to filter them out.
Continue reading “Filtering App Insights server-side Health Check requests”Filtering App Insights Successful server-side dependencies
Application Insights can record the performance of your dependencies – so things like requests to SQL server, MongoDB, etc.. That’s great – but it can become VERY verbose. I find frequently that most of my allocation of data is spent tracking every damn SQL statement run – and there could be hundreds in a single page load.
You can just turn on Dependency tracking completely – but that seems a bit of nuclear option. What if there IS a problem? I want to know about it!
Well, you can create your own Telemetry filter instead:
public class SuccessfulDependencyFilter : ITelemetryProcessor
{
	private readonly ITelemetryProcessor _nextProcessor;

	public SuccessfulDependencyFilter(ITelemetryProcessor nextProcessor)
	{
		_nextProcessor = nextProcessor;
	}

	public void Process(ITelemetry telemetry)
	{
		DependencyTelemetry dependencyTelemetry = telemetry as DependencyTelemetry;
		if (dependencyTelemetry != null)
		{
			if (dependencyTelemetry.Success == true )
			{
				return;
			}
		}

		_nextProcessor.Process(telemetry);
	}
}
This ITelemetryProcessor will check if the telemetry is a successful Dependency, and if it is, end processing (i.e. don’t write anything to App Insights).
To use it, add it to the ApplicationInsights.config in the TelemetryProcessors section:

Obviously, this means that if you have problems like a slow dependency that is still eventually successful then you won’t have any telemetry to show you that – but it VASTLY reduces the data being captured.
Filtering App Insights Client-Side successful dependencies
So, I found that our client JavaScript was recording quite a lot of successful dependency messages for loading 3rd party scripts:

Therefore, I wrote a telemetry filter to block sending them. I could just use sampling – but I’d prefer to have none.
onInit: function (sdk) {
	/*	Once the application insights instance has loaded and initialized this method will be called
	    This filter will block successful remote dependency requests being logged. */
	sdk.addTelemetryInitializer(function(envelope) {
		if (envelope.baseType === 'RemoteDependencyData')
		{
			if (envelope.baseData.success)
			{
				return false;
			}
		}
	});
},
From my testing, if the user blocks loading of a remote dependency I don’t see any kind of message being returned – even a failure, which is good.
Filtering App Insights Client Exceptions from 3rd party JavaScript
So, we are using App Insights, and when we moved the client side script for recording JavaScript errors to our integration test instance we started to get a lot of errors of the form:
Script error: The browser’s same-origin policy prevents us from getting the details of this exception. Consider using the ‘crossorigin’ attribute.
There were a lot of these errors:

… and investigating them showed that the problems came from 3rd party JavaScript. All of these are inserted by Google Tag Manager, and aren’t in the site, or local development.

Well, I’m not going to be able to fix JavaScript written by 2 third-parties, and that isn’t even loaded directly by my page – so instead I’m going to ignore that error…
Continue reading “Filtering App Insights Client Exceptions from 3rd party JavaScript”Hooking into Sitecore’s Logging
Sitecore uses Log4Net for it’s logging framework, so it comes with a whole slew of different ‘appenders’, suitable for logging to various repositories. That’s nice, but what if there’s a target you want to use that doesn’t exist?
Well, you can override the SitecoreLogFileAppender and write your own output:
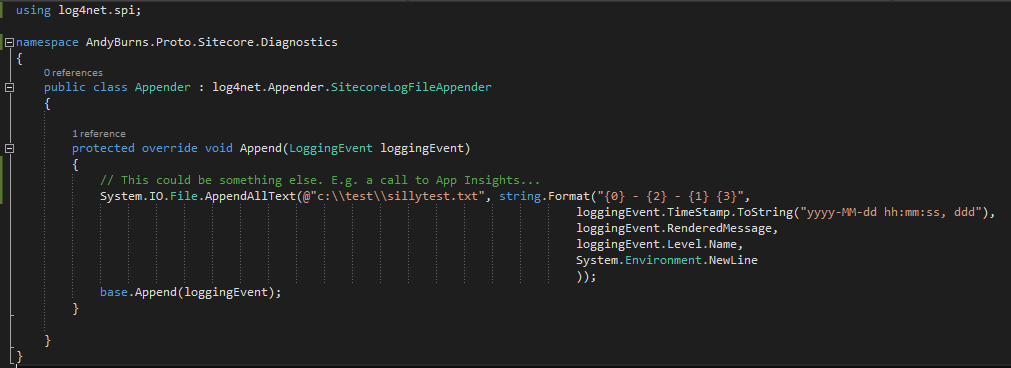
What else could you do with this? Well, writing to App Insights seems like a good bet.
Minifying JS – Skip removing line numbers?
I’m a big fan of App Insights, and I’m loving it’s increasing integration with Visual Studio. To me, it’s just great.
However, I did find myself laughing a bit at this. App Insights was recording JavaScript errors from a (third party’s) .JS file.

This is showing an error on Line 93. The thing is, the file has been minified – and all the code in the file is on line 93.
Hmm. All this would save is a couple of hundred bytes over the wire. I’m just not sure it’s worth it for most of the projects I work on. I think having the new-lines still in (albeit otherwise minified).
To be honest, we’d save more space by stripping out the 92 lines of Licensing information above the code. I’m not sure that that shouldn’t reside in a text file, and just have a comment referencing the licence information.
App Insights Visual Studio Integration is Fantastic
So, I do love App Insights, but I just realised that it’s even better than I’d thought. They’ve integrated it more closely with Visual Studio.
In the code you can see things at the top of each method – how many references it has, who last edited it, how long ago it was edited,, etc.
Well now you can also see the exceptions that were recorded by App Insights for that method in the last 24 hours:

Fantastic!
(And all those are expected exceptions. If anyone works out a way of doing a Response.Redirect() without a ThreadAbortException and still killing the page processing, let me know)
