Kusto is great, but one problem is that, if you’re summarizing and creating a time chart, and some of those time bins don’t have any results, then rather than your graph’s line going to zero, it skips those times. This results in a weird graph. Consider this:
This graph never goes to zero – because the groups don’t exist if their value is zero. It can also lead to weird lines that “skip” to the next value. Eg. the peak at 0000h on Apr 4 – it’s joined to a point at about 0145h. The intermediate points are skipped.
We’re looking to introduce whitelisting of Query String parameters on one of our customer’s sites. But that begs the question – what query strings parameters are in use? What are the most popular?
Well, I should be able to get this from the Application Gateway logs in Azure. But of course, the trick is in the right query. It took a bit of figuring out, but I got this:
AzureDiagnostics
| where Category == 'ApplicationGatewayAccessLog'
| where TimeGenerated > ago(7d)
| where isnotempty( requestQuery_s )
| extend qp = parse_urlquery(requestQuery_s)["Query Parameters"]
| extend keys = bag_keys(qp)
| mv-expand keys
| summarize count() by tostring(keys)
| order by count_ desc
This get the query string parameters for each query that has a query string, parses them, gets the keys (i.e. the parameters) and summarizes by them. Nifty.
We have our Sitecore instance writing it’s logs into Trace messages in App Insights. There is some filtering, but basically, the message written to the log file is put in the Message field of the Trace entries. So, an entry in the publishing log file would look like:
21192 14:23:07 INFO ##Publish Item: Name=Home, Uri=sitecore://master/{110D559F-DEA5-42EA-9C1C-8A5DF7E70EF9}?lang=en&ver=1, Operation=Skipped, ChildAction=Allow, Explanation=The source and target items have the same revision number.
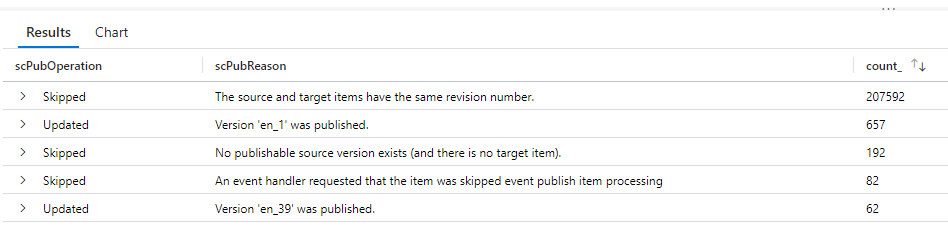
And in App Insights, it looks like:
The problem was, I wanted to summarize details about these publishes, but the details are all part of one big string. Specifically, I wanted to see the count of the operation, and the reason for that operation. I was expecting to have to do some big regex to figure it out.