If you’re adding Application Insights to your solution, you will need to specify a connection string. Usually, this is at the bottom of your applicationinsights.config file:
A nifty alternative is you can specify this connection as an Environment Variable – and App Insights will pick that up and use it…
Previously I posted about using a Log4Net Appender to record Sitecore logs to Application Insights. That code will write Trace Messages to App Insights. I’m already filtering the messages to WARN or above using standard Log4Net <filter>s – but what if I need to filter more particular messages. Well, I wrote a telemetry processor to do this, just like Requests and Dependencies.
Sitecore’s installer for Azure app services installs a neat feature; a Log4Net appender that writes Sitecore log entries to Application Insights as TRACE messages. Nifty! However, for reasons I cannot comprehend, this is not included in the normal installer. That’s a terrible shame, as App Insights is still useful for Sitecore running on actual tin or in a VM.
My Sitecore instance seems have a failing dependency that is clogging up my logs. It’s the same as mentioned in this StackExchange question. It doesn’t seem to cause any issue, though… and it isn’t every environment either. Anyway, I’d like to block it. Telemetry processors to the rescue…
So, again, I’m trying to tame Application Insights. My logs are filling up with various requests for different health-check URLs. These get requested, over and over, day after day, and all are recorded in App Insights as Requests. However, I don’t care about these requests if they’re successful. In fact, I only care about if they fail. Can I exclude them?
Yes, I can. I’ll build a telemetry processor to filter them out.
Application Insights can record the performance of your dependencies – so things like requests to SQL server, MongoDB, etc.. That’s great – but it can become VERY verbose. I find frequently that most of my allocation of data is spent tracking every damn SQL statement run – and there could be hundreds in a single page load.
You can just turn on Dependency tracking completely – but that seems a bit of nuclear option. What if there IS a problem? I want to know about it!
Well, you can create your own Telemetry filter instead:
public class SuccessfulDependencyFilter : ITelemetryProcessor
{
	private readonly ITelemetryProcessor _nextProcessor;

	public SuccessfulDependencyFilter(ITelemetryProcessor nextProcessor)
	{
		_nextProcessor = nextProcessor;
	}

	public void Process(ITelemetry telemetry)
	{
		DependencyTelemetry dependencyTelemetry = telemetry as DependencyTelemetry;
		if (dependencyTelemetry != null)
		{
			if (dependencyTelemetry.Success == true )
			{
				return;
			}
		}

		_nextProcessor.Process(telemetry);
	}
}
This ITelemetryProcessor will check if the telemetry is a successful Dependency, and if it is, end processing (i.e. don’t write anything to App Insights).
To use it, add it to the ApplicationInsights.config in the TelemetryProcessors section:
Obviously, this means that if you have problems like a slow dependency that is still eventually successful then you won’t have any telemetry to show you that – but it VASTLY reduces the data being captured.
So, I found that our client JavaScript was recording quite a lot of successful dependency messages for loading 3rd party scripts:
These are all analytics tools, and to be honest, I don’t care about them. Sure, it can be useful to know how long they take to load, but these are loaded after the page is ready, so even if they are slow they shouldn’t impact performance. And I don’t really think I need to know every time a user loads these analytics tools.
Therefore, I wrote a telemetry filter to block sending them. I could just use sampling – but I’d prefer to have none.
onInit: function (sdk) {
	/*	Once the application insights instance has loaded and initialized this method will be called
	    This filter will block successful remote dependency requests being logged. */
	sdk.addTelemetryInitializer(function(envelope) {
		if (envelope.baseType === 'RemoteDependencyData')
		{
			if (envelope.baseData.success)
			{
				return false;
			}
		}
	});
},
From my testing, if the user blocks loading of a remote dependency I don’t see any kind of message being returned – even a failure, which is good.
So, we are using App Insights, and when we moved the client side script for recording JavaScript errors to our integration test instance we started to get a lot of errors of the form:
Script error: The browser’s same-origin policy prevents us from getting the details of this exception. Consider using the ‘crossorigin’ attribute.
There were a lot of these errors:
… and investigating them showed that the problems came from 3rd party JavaScript. All of these are inserted by Google Tag Manager, and aren’t in the site, or local development.
Well, I’m not going to be able to fix JavaScript written by 2 third-parties, and that isn’t even loaded directly by my page – so instead I’m going to ignore that error…
Right, I keep having to do this, and keep having to look this up, so here it is.
If you want to do a web transform for an assembly binding redirect it can be a bit tricky. The assembly details are in an <assemblyIdentity /> element, and the <bindingRedirect /> is its sibling. Yeah, I don’t know why it was designed this way; I’m assuming alcohol was involved. Yes, having the oldVersion and newVersion attributes in the same element at the assembly’s identity would be much simpler.
Anyway, it is what it is. An alternative is to replace the entire <dependentAssembly /> element, but the locator becomes a bit more fiddly. Still, it works. See this example – the locator on the parent element is checking the name of the child assemblyIdentity.
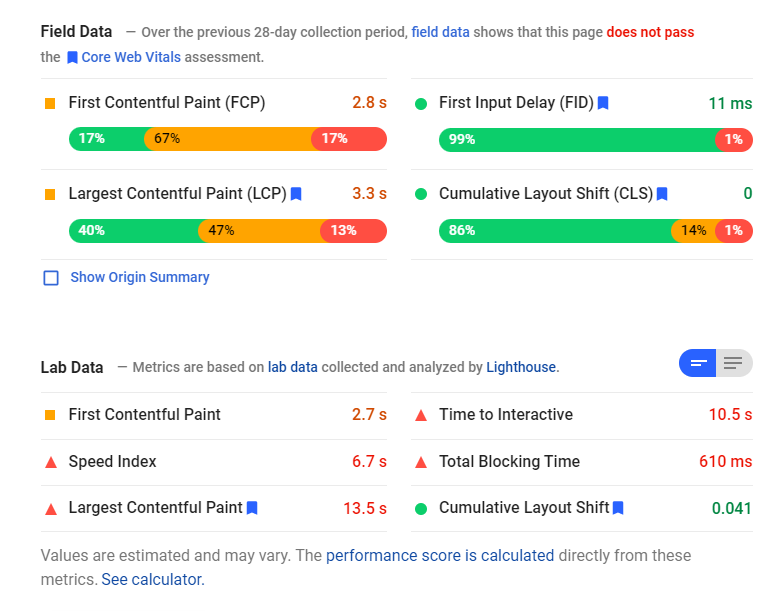
So, we’re all familiar with the Core Web Vitals scores, right? Just in case we’re not, lets recap. These are scores that Google uses to just the speed of your page. It’s more than just “How much data” does the page use, or “When is the DOM ready”, but also includes things like “When is the content painted on the page” and “How much does stuff shift as the page is loaded”.
This is actually really good, as these are much better metrics; people want your page to read, and these metrics focus on that.
So, one of the things I’ve noticed is that a number of our customers are not getting great scores for the Largest Contentful Paint (LCP) – and this seems to be due to a particular bugbear of mine – carousels.