Kusto is great, but one problem is that, if you’re summarizing and creating a time chart, and some of those time bins don’t have any results, then rather than your graph’s line going to zero, it skips those times. This results in a weird graph. Consider this:

This graph never goes to zero – because the groups don’t exist if their value is zero. It can also lead to weird lines that “skip” to the next value. Eg. the peak at 0000h on Apr 4 – it’s joined to a point at about 0145h. The intermediate points are skipped.
This can be fixed.
If we add this into our Kusto:
| make-series requests=count() on TimeGenerated step 15m
| mv-expand TimeGenerated, requests
| project todatetime(TimeGenerated), toint(requests)
This makes a series, which is like a summarize, though zero values are honoured. Then it expands the resulting structure into something that can be used in a time chart. This results in:
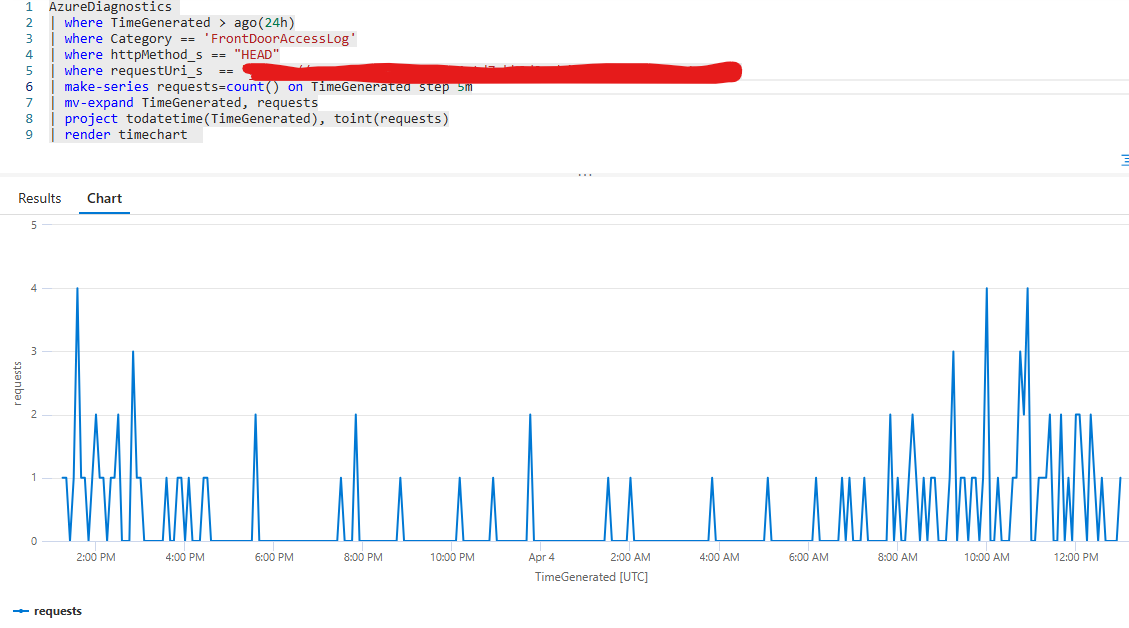
This is accurate; time bins with no values are shown as zero!
Note that make-series function can also take a ‘by’ parameter too, so it can group by another value.
